Taking the Long View: A Bitcoin Price Retrospective
As we navigate the 14th year that the Bitcoin network has been live, the value of looking at the asset’s price through a wider lens has never been more apparent. Doing so allows us to break through the sensationalism and hysteria that can come with only observing Bitcoin’s price movements on a short-term basis. While we know that the year so far has not been too kind to the world’s most popular digital currency, how does this narrative change when we zoom out?
A lot of press in and beyond the crypto space is generated as a result of fluctuations in Bitcoin’s price. An article published by Bloomberg in January 2022 reports that Bitcoin dipped to a six-month low, emphasizing that the asset is worth more than 40% less than it was in November of the previous year—around the time its price reached a new all-time high. What wasn’t mentioned in the article is the fact that Bitcoin was still up a substantial amount over longer periods of time. For instance, as of press time today, the price of Bitcoin is still up more than 13% since this time last January.
This isn't an indictment of Bloomberg’s reporting—after all, routine headlines about Bitcoin and other cryptocurrencies often relate to their price. On any given day, you’ll find a wealth of articles published about how Bitcoin’s price has either climbed or dropped by a certain amount. These articles serve a functional purpose: many participants in the crypto space have a vested interest in monitoring how their holdings are valued on any given day or over a specified period of time. Especially for high-volume day traders, these stories may serve as an indicator of when they should—or perhaps shouldn’t—decide to buy or sell crypto. In this way, reports on crypto prices aren't much different from the sensational daily stock market roundups seen on the nightly news.
But just as NASDAQ fluctuations shouldn't be a signal to liquidate your 401(k), focusing on crypto prices in a narrow window of time creates a narrative that ignores the big picture altogether. In order to build this context, we need to look at broader trends.
Bitcoin began 2022 up over 62% from the previous year
Throughout this article, we’re going to be focusing on how Bitcoin was valued as of the beginning of each year. Doing so will provide some much-needed context when it comes to how Bitcoin is performing over longer periods of time.
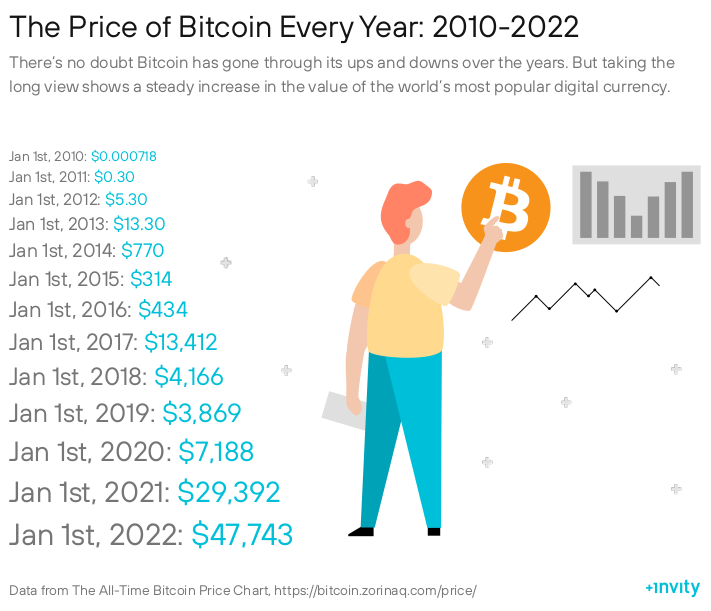
According to the All-Time Bitcoin Price Chart, a single coin cost around $47,743 on January 1, 2022. One year ago, in 2021, Bitcoin’s market price was listed at approximately $29,392.
➡ This means that anyone who held Bitcoin over this length of time would have seen their holdings increase by around 62.4%.
Between January 1, 2020, and 2022, Bitcoin soared 564%
Expanding our retrospective to the two-year range shows even more impressive Bitcoin returns. On January 1, 2020, the market price for Bitcoin was in the ballpark of $7,188 USD per coin. As a refresher, it was valued at $47,743 at the beginning of this year.
➡ Over this two-year period of time, Bitcoin saw a price increase of around 564%.
Bitcoin’s price increased 1,046% in five years
Looking back to 2018 spins an overwhelmingly positive story for the world’s largest digital asset. At the beginning of that year—not even a full decade after Bitcoin's introduction into the world—its market value was around $4,165. This means the price of BTC was a full decimal point—and a few thousands in "change"—away from its price right after socially-distanced Auld Lang Synes where chanted this new year.
➡ Between January 1, 2018, and 2022, Bitcoin increased 1,046%.
How much has the price of Bitcoin increased in ten years?
Having only been live for shy of three years, Bitcoin was still far from easy to purchase in 2012. Less than two years prior, Bitcoin fans around the world had rejoiced when the asset was used to purchase a real-world item for the first time thanks to an early-adopter spending 10,000 BTC on two pizzas. It was very much an asset used by those who were extremely tech literate. This stands in stark contrast to today, when buying and managing digital assets has never been easier.
Ready to see just how easy? Check out the Invity Beginner's Guide to Crypto for 3 easy steps to make your first Bitcoin transaction!
But had you managed to buy Bitcoin in 2012, you’d have likely spent a little over $5 a coin on January 1 of that year. If you’d like to calculate the percentage increase yourself, the figure you’ll need to use is $47,743. Got your calculator ready?
➡ If not, we’ve got you covered: the price of Bitcoin increased 906,235% in a decade.
What does this retrospective show us?
The aim of this article is not to try and obfuscate Bitcoin’s recent price downturn or sell some kind of fantastical promise. There isn’t enough money in the world for BTC to ever skyrocket by another six-digit percentage. Rather, this retrospective just aims to provide a little more context to alarmist daily coverage of the asset’s price movements that often make it seem like Bitcoin is dead once and for all.
It can’t be denied that Bitcoin’s price is, as of the time of this article’s publication, down from the highs that the asset enjoyed just months ago. However, it is equally important to recognize that these recent price movements are not indicative of the full picture behind the digital currency that has still enjoyed an upward trend of price increases over its lifetime.
Cover photo: Stock market quotes in newspaper by Andreas Poike, licensed under CC BY 2.0.